
![]()
![]()
ggtypst brings Typst-powered high-quality text and math rendering to ggplot2. Without requiring a separate local Typst or LaTeX setup, you can add rich text and math equations directly to your ggplot2 plots through three public API families:
-
annotate_*()for one-off annotations -
geom_*()for data-driven text layers -
element_*()for Typst-rendered theme text
ggtypst supports both native Typst math and LaTeX-style math thanks to MiTeX. Just choose the math style you are more familiar with.
ℹ️ For showcases, please see Showcase below.
Highlights
Typst gives you expressive text layout, math typesetting, programmable markup and high-quality rendering in a compact syntax. ggtypst uses that strength inside ggplot2 without asking you to leave the plotting pipeline.
- ✍️ Write raw Typst markup directly inside
ggplot2 - ⚙️ Render high-quality equations without installing Typst or LaTeX separately
- 📊 Plot rich titles, axis, facets, and legends with Typst content
- 🎨 Customize text size, colors, angles, faces, and families freely
- 🔁 Choose native Typst math or LaTeX-style math, depending on your preference
- 🧩 Keep the familiar
ggplot2layout system and theme semantics
Installation
Install from pre-compile binary
Install ggtypst from R-universe first so you can use the prebuilt package and avoid compiling Rust locally. On Windows and macOS, you can run:
install.packages("ggtypst", repos = "https://yousa-mirage.r-universe.dev")On Ubuntu 24.04, you should run:
linux_binary_repo <- function(universe){
  sprintf(
    "https://%s.r-universe.dev/bin/linux/noble-%s/%s/",
    universe,
    R.version$arch,
    substr(getRversion(), 1, 3)
  )
}

install.packages("ggtypst", repos = linux_binary_repo("yousa-mirage"))
Install from source code
If you are on other Linux platforms, or you need the latest development version, you can install it from source:
install.packages("remotes")
remotes::install_github("Yousa-Mirage/ggtypst")
Because the GitHub installation builds the Typst backend in Rust, you need rustc and cargo on your system to compile it. Particularly on Windows, you must use the x86_64-pc-windows-gnu toolchain.
Regardless of how you install ggtypst, you don’t need a separate local Typst or LaTeX installation to use it.
Get Started
Please read Get Started to get a detailed guide to ggtypst. There you will find instructions and examples on how to use ggtypst to plot rich content.
Showcase
With ggtypst, you can easily make publication-ready scientific figures with excellent rich text and math equations. Below are three example plots showcasing the three main workflows: annotations, data-driven labels, and Typst-powered theme elements.
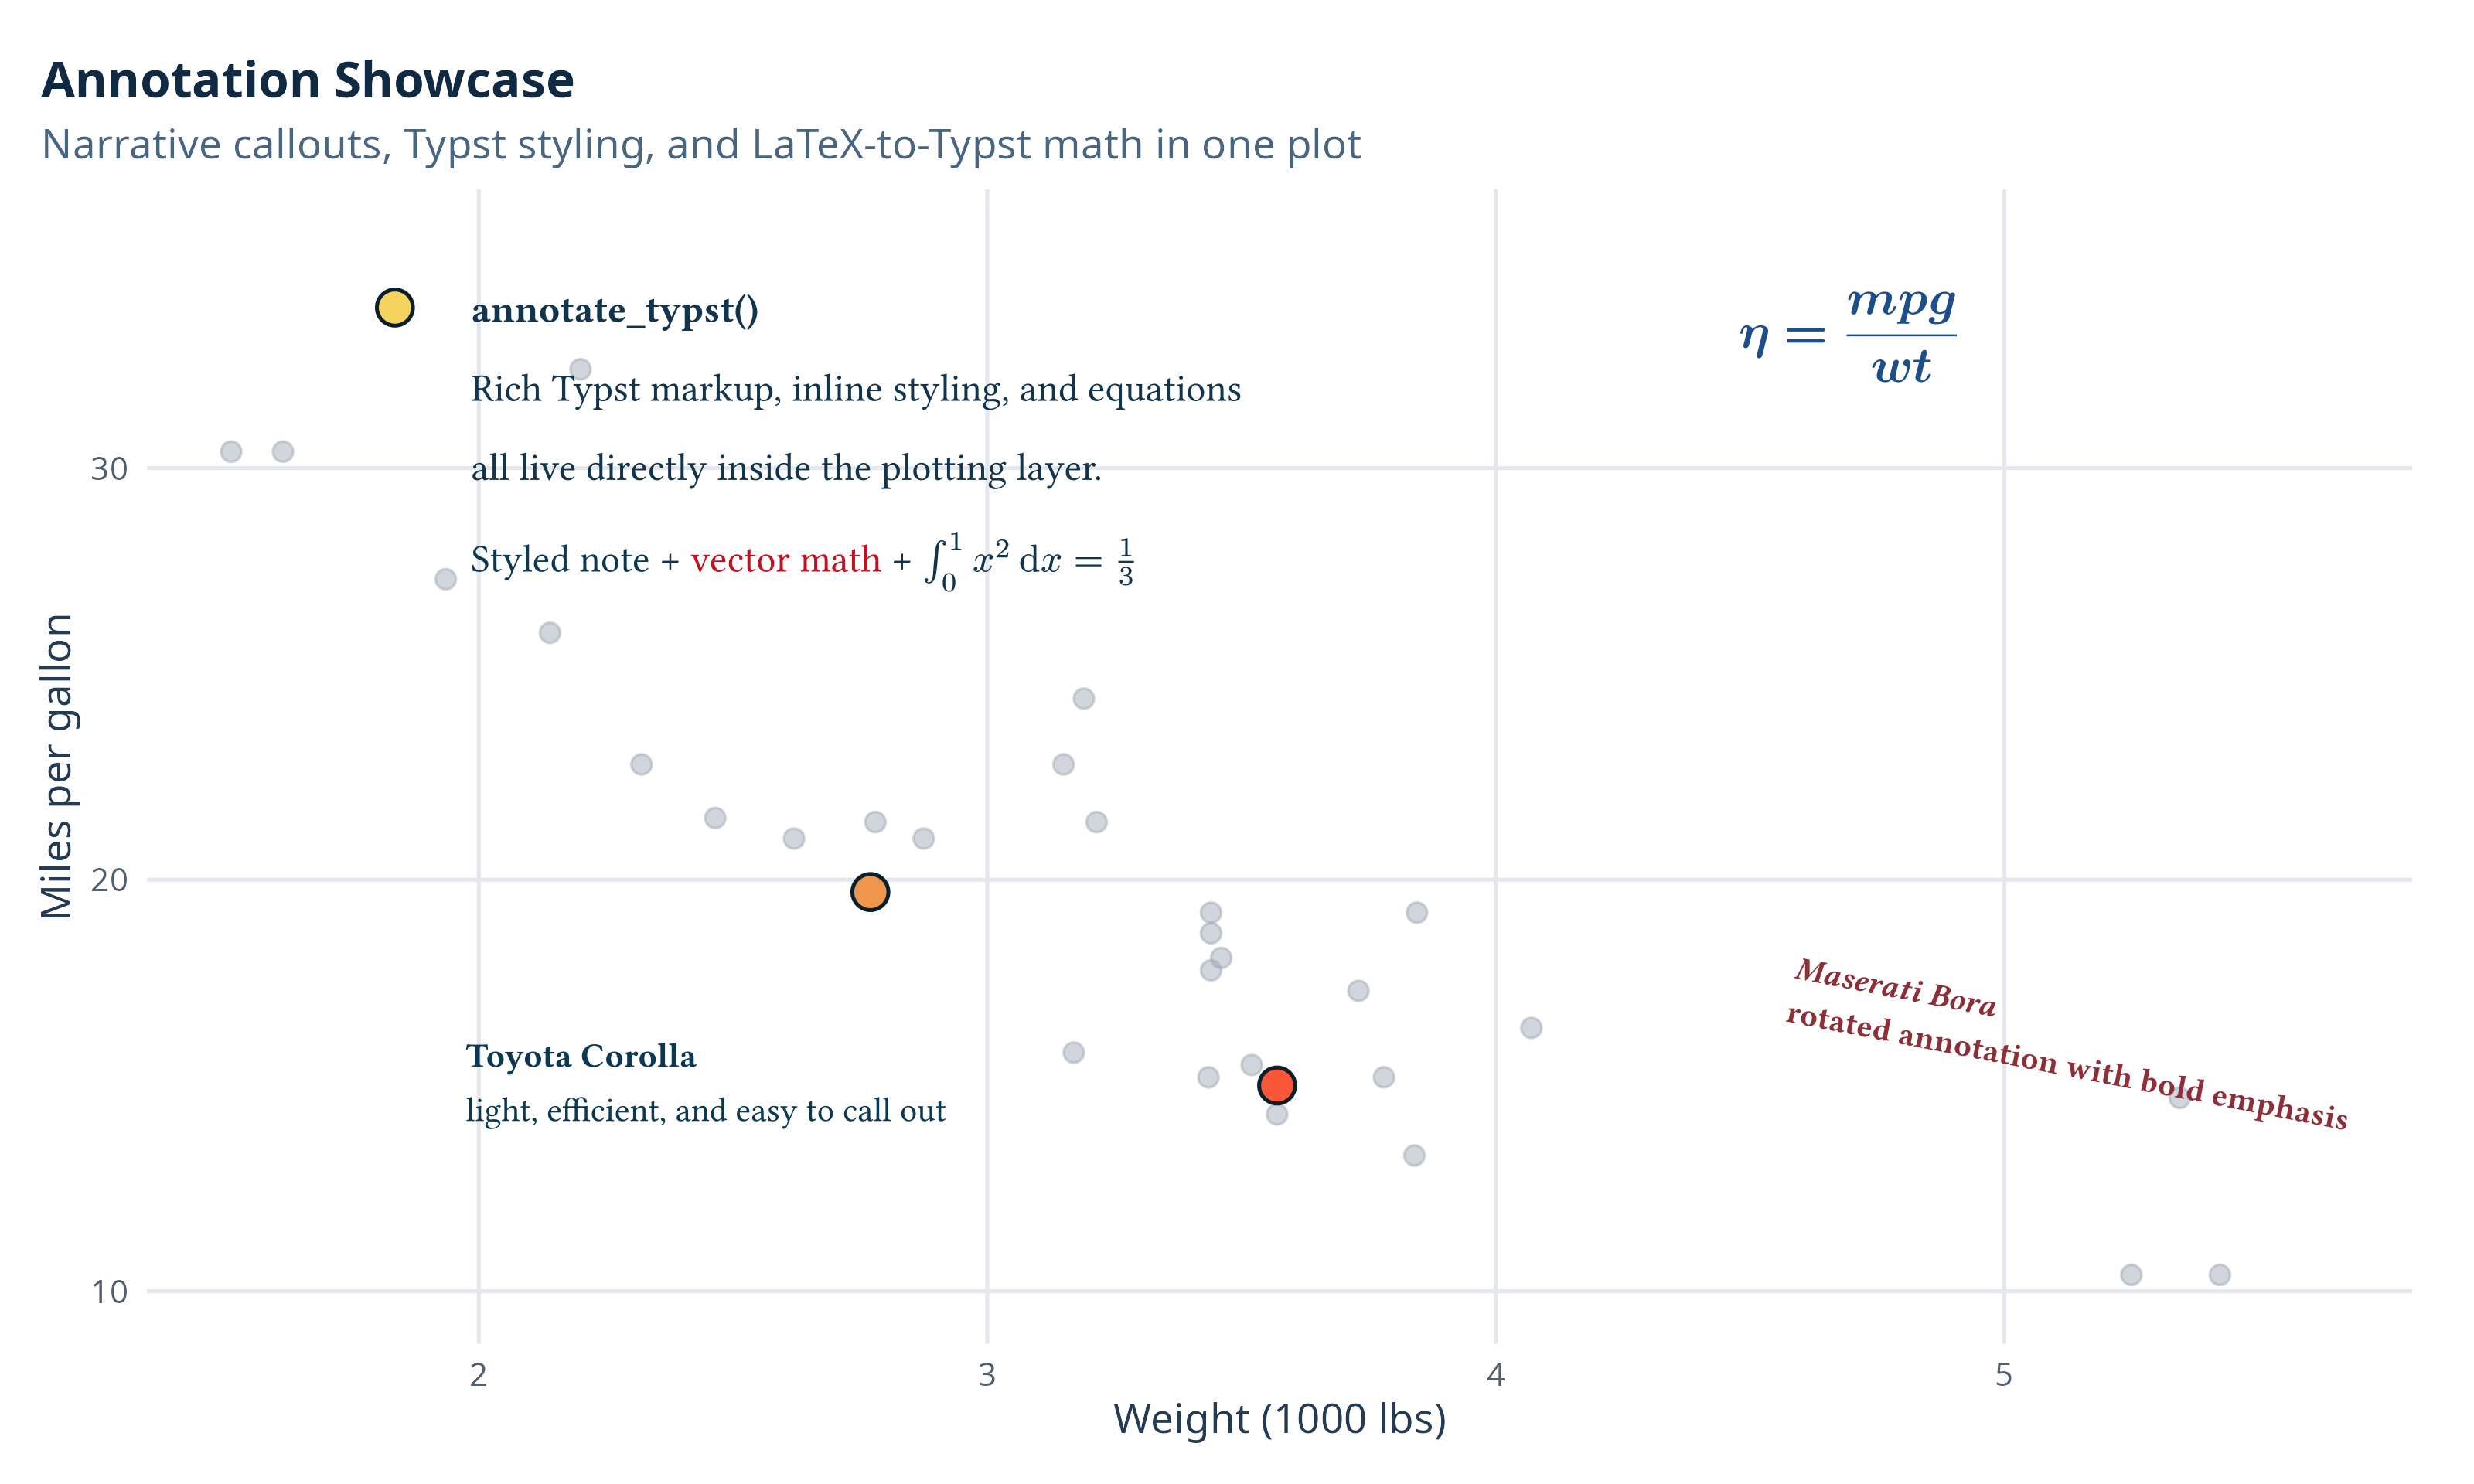
Annotation: Just add something
annotate_typst(), annotate_math_typst(), and annotate_math_mitex() let you place rich notes, callouts, or equations at precise plot locations.
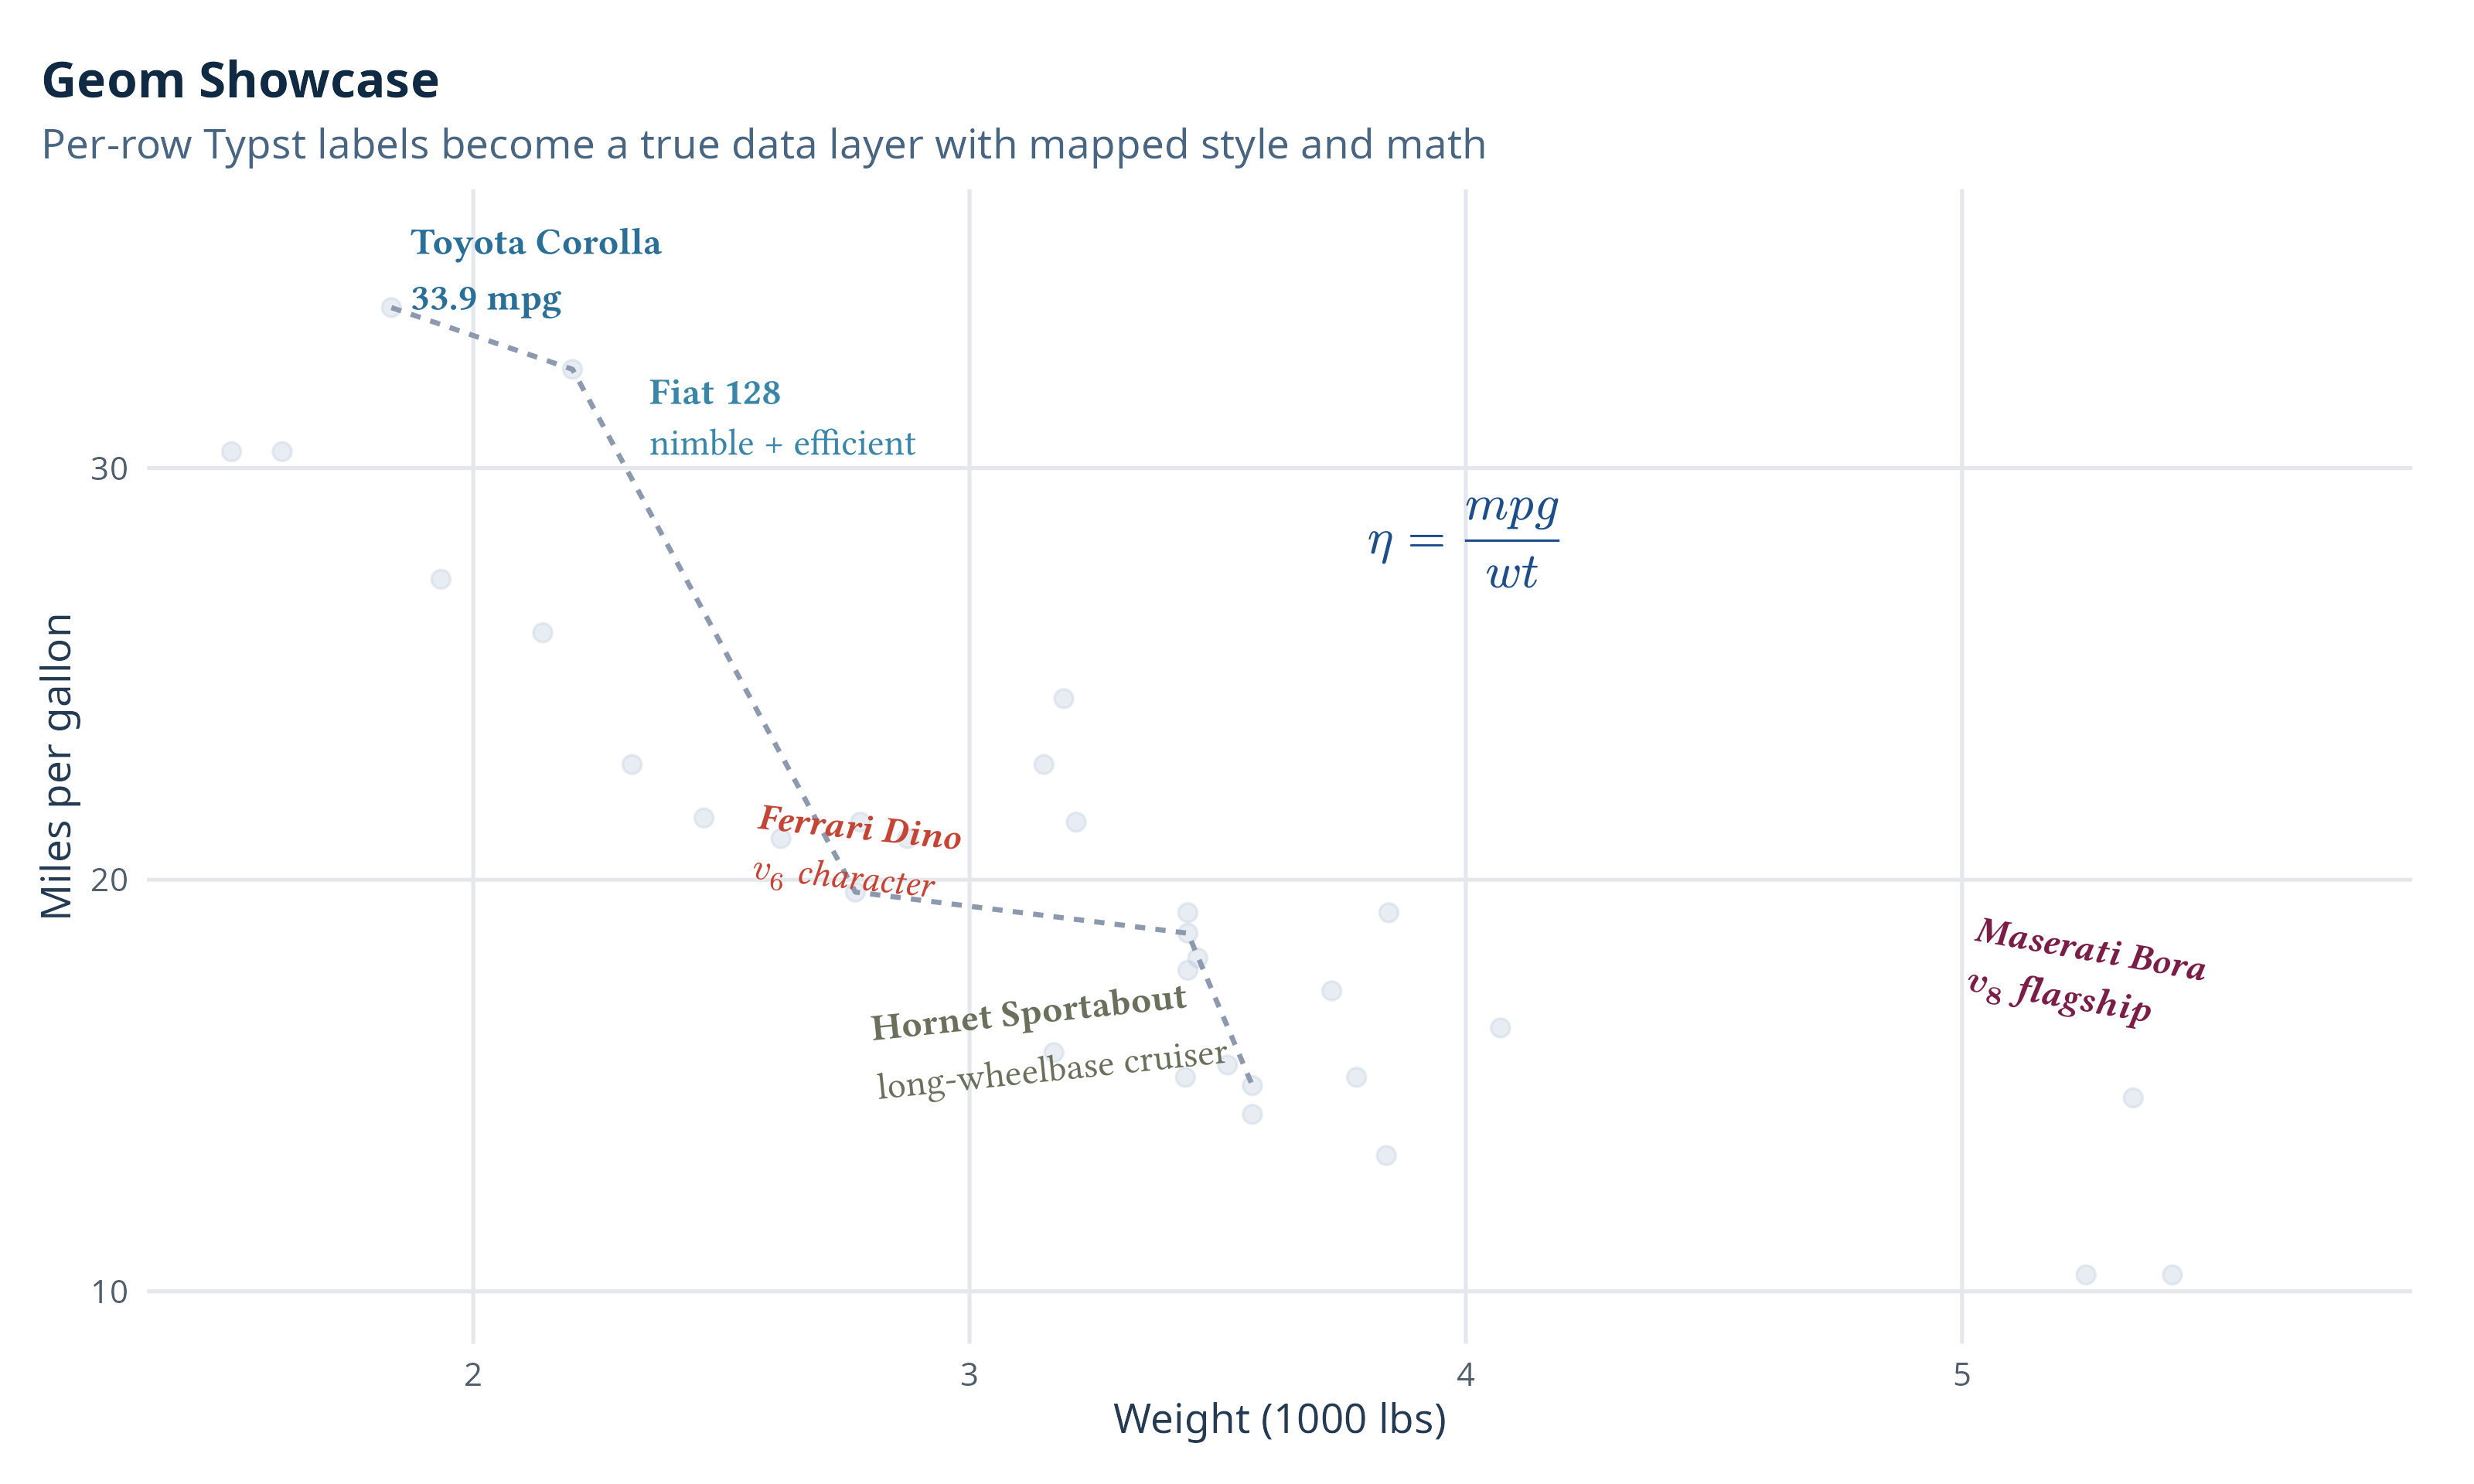
Geom: Data-driven labels
geom_typst(), geom_math_typst(), and geom_math_mitex() turn Typst labels into real plotting layers, so styling and label content can vary row by row.
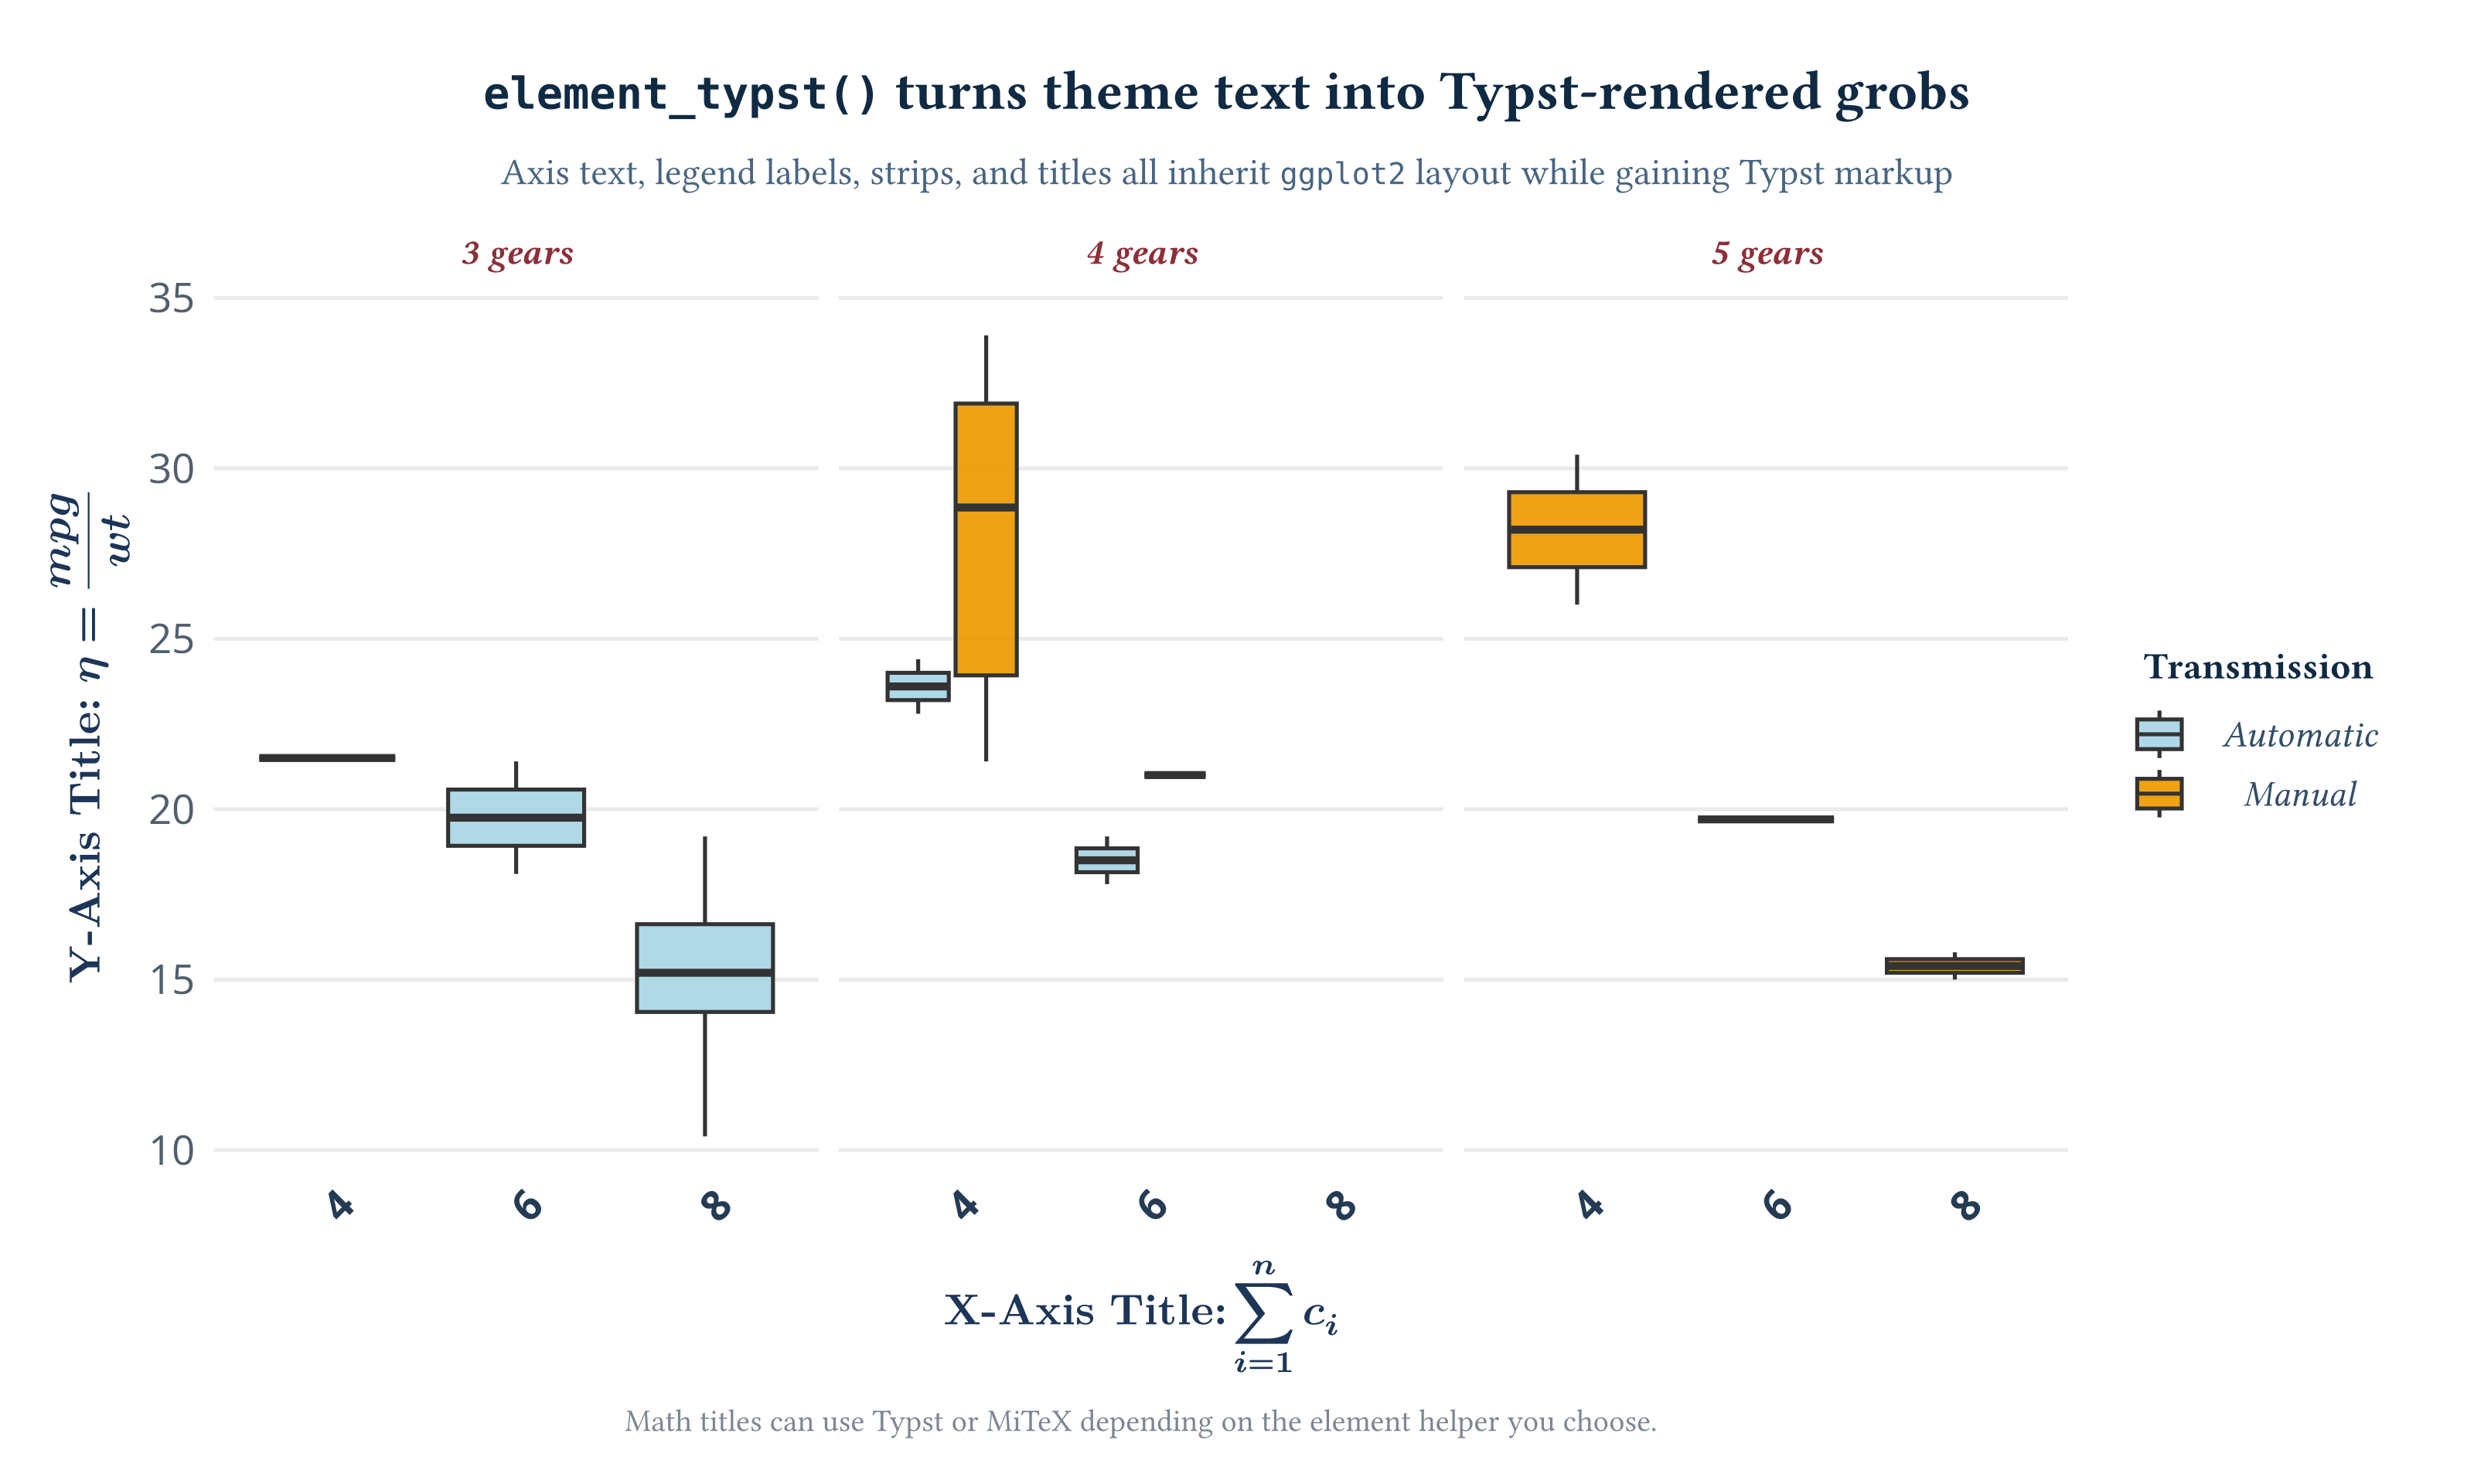
Element: Render theme elements
element_typst(), element_math_typst(), and element_math_mitex() take over the themes and rendering of titles, axis labels, strips, and legends. You can even render a matrix as the title!
Contributing
If you find any bugs or errors in ggtypst, you can report them on GitHub Issues. Remember to attach an image and reproduction code to show the issue clearly.
If you would like to contribute, please take a look at the contributing guide for instructions.
Acknowledgements
ggtypst would not exist without two excellent upstream projects:
The ggtypst icon was made with hexSticker and designed by Yousa Mirage.