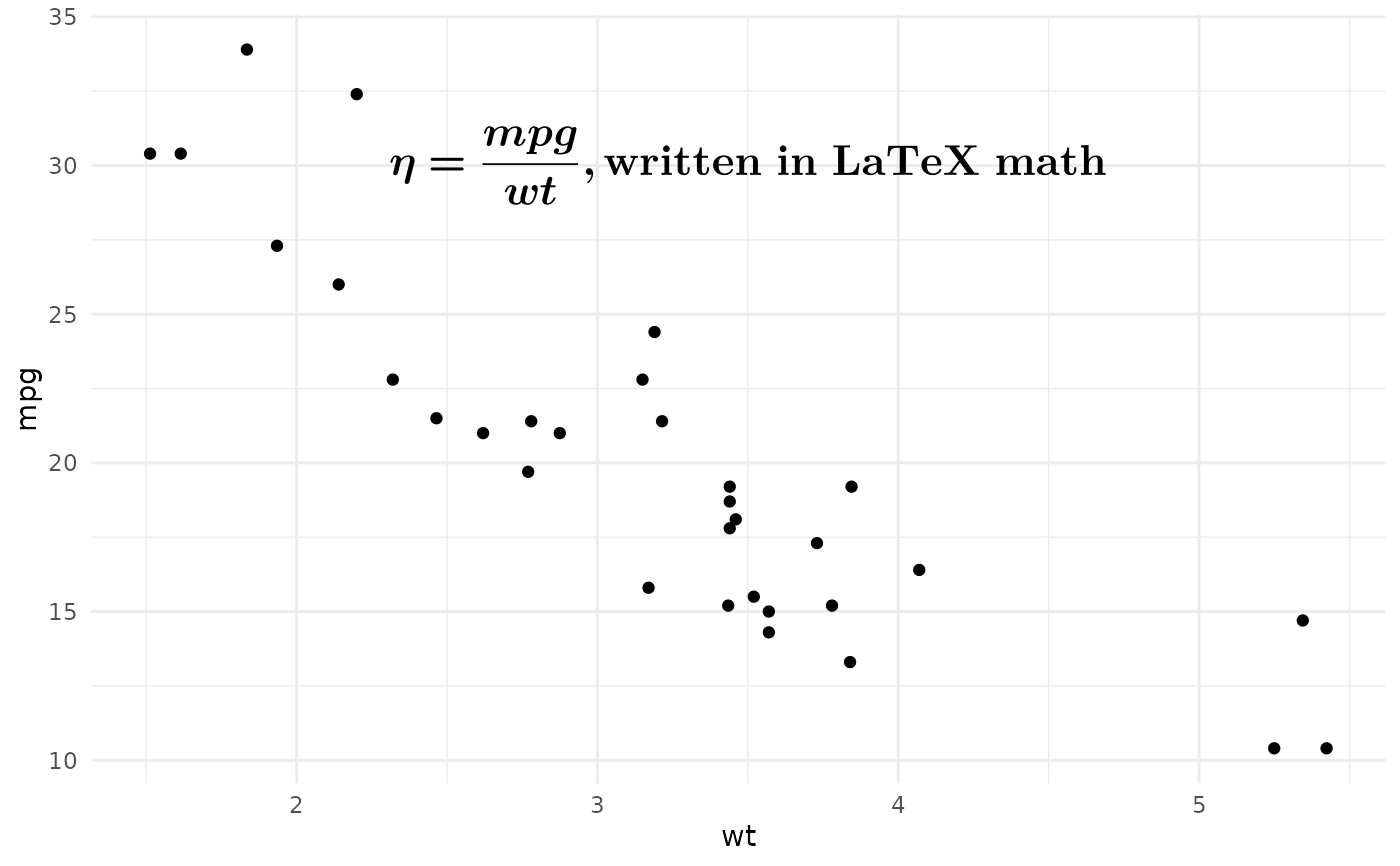
annotate_math_mitex() is the LaTeX-input companion to annotate_math_typst().
It accepts LaTeX-style math, converts it to Typst math through MiTeX,
and renders the converted result as a single annotation.
It will normalize the outer $...$ or $$...$$ delimiters automatically.
This allows you to use LaTeX math syntax in your plot, which you may be more familiar with :).
Usage
annotate_math_mitex(
  latex_math_code,
  x,
  y,
  hjust = 0.5,
  vjust = 0.5,
  scale = 1,
  size = NULL,
  size.unit = "pt",
  color = NULL,
  colour = NULL,
  alpha = NULL,
  face = NULL,
  fontface = NULL,
  angle = NULL,
  lineheight = NULL,
  math_family = NULL,
  inline = FALSE
)
Arguments
- latex_math_code
A single LaTeX math string. Outer
$...$or$$...$$delimiters are optional.- x, y
The annotation position in data coordinates.
- hjust, vjust
Horizontal and vertical justification for the rendered grob (
0= bottom,0.5= center,1= top).- scale
A positive scaling factor applied to the rendered Typst size.
- size
Optional text size.
- size.unit
The unit of
size. Defaults to points ("pt"). Use"mm"for ggplot2-style text sizes.- color, colour
Optional text color. RGB or color name are supported.
- alpha
Optional color alpha multiplier in
[0, 1].- face, fontface
Optional math face. Only
"plain"and"bold"are supported, because math text in Typst is italic by default.- angle
Optional text rotation angle in degrees.
- lineheight
Optional line height value. May be negative.
- math_family
Optional font family for math content. The default math font is
New Computer Modern Math. To render a math expression, you don't need to set this and even don't need to haveNew Computer Modern Mathinstalled on your system. Typst has embedded this font by default.- inline
Whether to render inline math. Default
FALSErenders display-style math.
Details
MiTeX is a LaTeX-to-Typst converter. It should be stable and reliable for typical LaTeX math expressions. If you find any LaTeX math that MiTeX fails to convert properly, you can report an issue to ggtypst first.