element_typst() is a more powerful replacement for ggplot2::element_text() and ggtext::element_markdown() that
renders each theme element through Typst. Use it for plot titles, subtitles,
axis titles, axis text, facet strips, legend text, and other theme slots that
accept text elements.
Usage
element_typst(
  hjust = NULL,
  vjust = NULL,
  scale = NULL,
  size = NULL,
  size.unit = "pt",
  color = NULL,
  colour = NULL,
  alpha = NULL,
  face = NULL,
  fontface = NULL,
  angle = NULL,
  lineheight = NULL,
  family = NULL,
  math_family = NULL,
  margin = NULL,
  debug = NULL,
  inherit.blank = FALSE
)
Arguments
- hjust, vjust
Horizontal and vertical justification for the rendered grob (
0= bottom,0.5= center,1= top).- scale
A positive scaling factor applied to the rendered Typst size.
- size
Optional font size.
- size.unit
The unit of
size. Defaults to points ("pt"). Use"mm"for ggplot2-style text sizes.- color, colour
Optional text color. RGB or color name are supported.
- alpha
Optional color alpha multiplier in
[0, 1].- face, fontface
Optional text face:
"plain","bold","italic", or"bold.italic".- angle
Optional text rotation angle in degrees.
- lineheight
Optional line height value. May be negative.
- family
Optional text font family. The family must be available to Typst. If
NULLor not found, the default family will be used. If you want to show specific languages or characters (e.g., Chinese, Japanese, emoji), you may need to set this.- math_family
Optional font family for math content. The default math font is
New Computer Modern Math. To render a math expression, you don't need to set this and even don't need to haveNew Computer Modern Mathinstalled on your system. Typst has embedded this font by default.- margin
Optional text margins created with
ggplot2::margin().- debug
If
TRUE, draw a coloured rectangle behind each label for debugging layout.- inherit.blank
If
TRUE,element_blank()parents suppress this element.
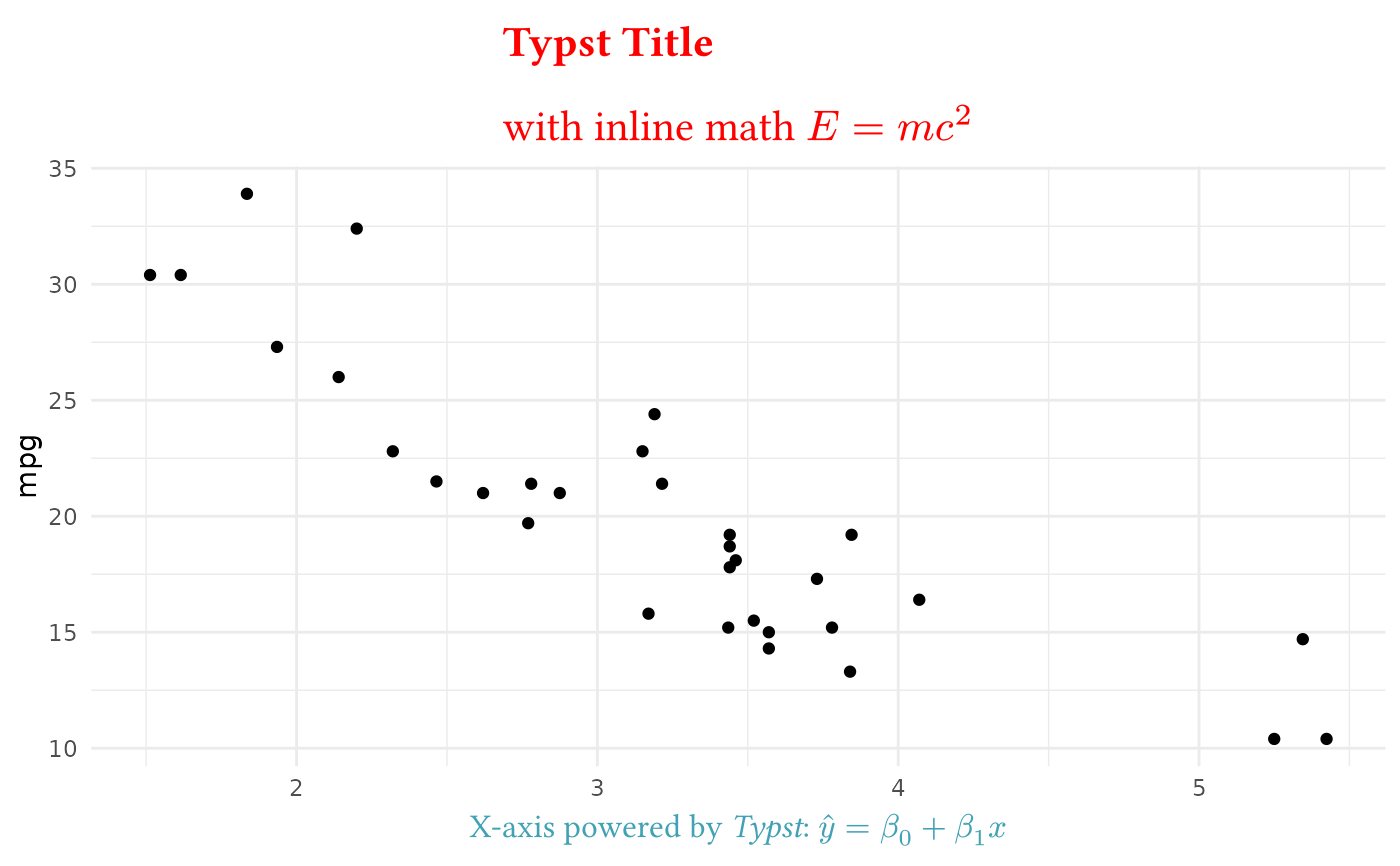
Examples
ggplot(mtcars, aes(wt, mpg)) +
  geom_point() +
  labs(
    title = r"(*Typst Title* #linebreak() with inline math $E = m c^2$)",
    x = r"(X-axis powered by _Typst_: $hat(y) = beta_0 + beta_1 x$)"
  ) +
  theme_minimal() +
  theme(
    plot.title = element_typst(size = 18, color = "red"),
    axis.title.x = element_typst(size = 14, color = "#40a2b4")
  )